
Have you ever presented an idea to leadership for them to say it’s too expensive? In a capitalist society, it makes sense; after all, organizational dollars are precious and essential. In the public sector, it makes sense as government officials act as stewards of taxpayer dollars. But looking at the cost alone is a pitfall. I can recall numerous pitches where the decision maker’s perception was focused solely on the price tag being too high. What if we help innovative idea generators show the relationship between cost and impact? What if we helped the organizational culture transform to ask questions like, what will the impact be? If the short-term investment improves both the long-term strategy and budget, shouldn’t we at least hear them out?
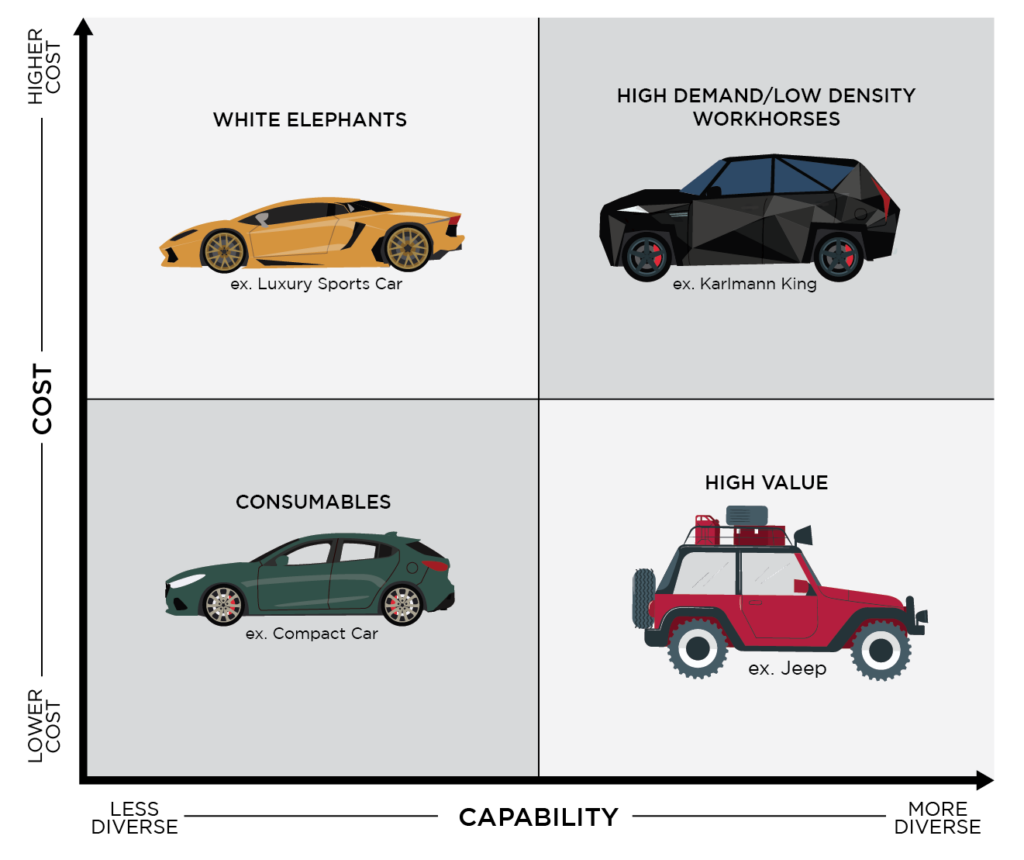
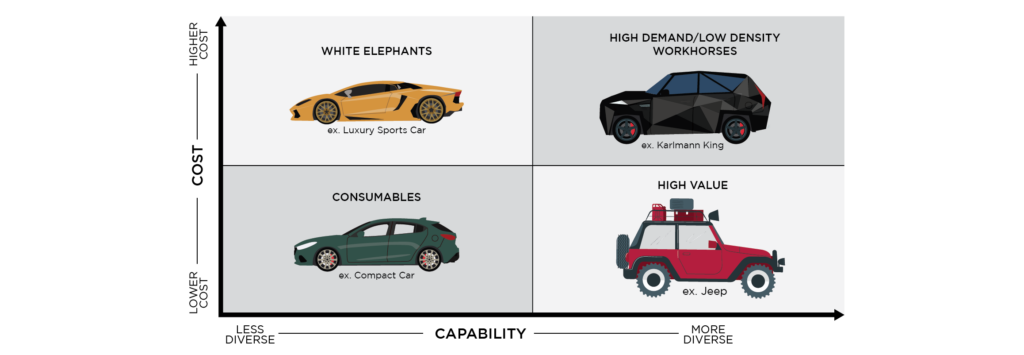
So how do we show the cost and impact? Let’s look at the cost and capability matrix. On the y-axis, Cost represents the total lifecycle cost per individual unit. On the x-axis, Capability, can be measured in different ways depending on what you provide. For instance, the capability could be less diverse or more diverse. Like a simple Swiss Army knife on the less side compared to a robust Swiss Army knife with many tools on the more side.
Before we go down the rabbit hole of use cases, let’s talk about each quadrant and their relationship to common methodologies like Moore’s Adoption Curve[1], Wardley Mapping[2], or Disruption Risk Matrix[3]. Why do these methodologies matter? Understanding the relationship between the matrix and these methodologies will help you understand the types of people or adopters you’re interacting with. They allow you to (1) understand the changes necessary to implement, (2) build your investment strategy, or (3) manage your existing portfolio of investments.
Quadrant 1, Consumables: Low Cost/Low Capability, represents low-cost, high-volume products and services focused on simply getting the job done. They lack customization but appeal to the pragmatic seeking affordable options to meet basic needs. This is akin to Efficient Commuter vehicles: Where affordability meets practicality, the compact car acting as daily workhorses for those focused on utility and stretching every dollar. On the innovation curve, these solutions cater to wide adoption once easily accessible and reliable; on a Wardley Map, they fill simple niches as a commodity but may face declining relevance over time.
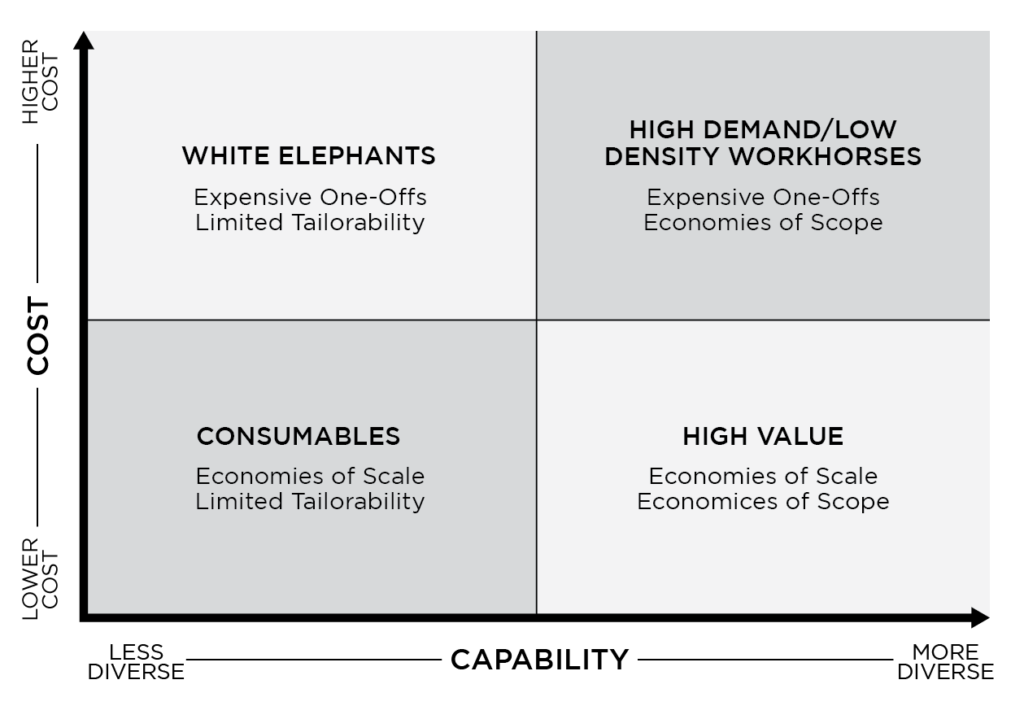
In Quadrant 2, White Elephants: High Cost/Low Capability, hosts expensive and specialized solutions catering to limited but crucial applications; these innovations service high-priority needs for specialized adopters willing to tolerate higher costs and lower flexibility in exchange for tailored capabilities. This quadrant is akin to Bespoke Marvel vehicles: Crafted with meticulous attention, these high-cost marvels redefine automotive sophistication, appealing to those who appreciate the extraordinary. Though broader mainstream adoption may be unlikely, these innovations occupy critical niches, providing highly designed systems for use cases demanding extensively customized or state-of-the-art functionalities appropriate for particular vanguard early adopters.
Moving along the bottom, Quadrant 3, High Value: Low Cost/High Capability, contains flexible, customizable solutions catering to early adopters craving new capabilities; these commoditized products provide mass-market options at affordable levels for the moderately risk-tolerant majority. This quadrant resembles “Innovations for All”: High-Value vehicles bring advanced features within reach, catering to those eager for cutting-edge capabilities without breaking the bank. On the innovation curve, early adopters flock to these innovative offerings as their prices become accessible.
Finally, Quadrant 4, High demand/low-density Workhorses: High Cost/High Capability, provides specialized, customized solutions for those willing to tolerate high costs and risks for advanced capabilities tailored to their needs; though expensive due to few units and economies of scope, these custom-built innovations cater to unaddressed niches. This quadrant is akin to Trailblazing Titans: High-density workhorses, where high costs fuel groundbreaking innovations. On the innovation curve, risk-taking innovators fuel this high-risk, high-reward quadrant focused on groundbreaking inventions, while on a Wardley map, the emphasis is genesis and custom solutions stretching capabilities beyond current commoditized offers.
From budget constraints to battlefield decisions, striking the right balance between cost and capability is a constant challenge for leaders across government, military, and business spheres. We’ve overviewed how this framework offers leaders advanced tradeoff analysis. By mapping solutions against the matrix, organizations gain critical visibility into portfolios spanning maturity levels, adoption risks, capability outcomes, and adjacent possibilities – profoundly empowering objective, data-driven choices optimizing limited resources. Now we turn to explore each quadrant in greater depth, starting with the mature, economical offerings in Quadrant 1: highlighting real-world applications of the matrix for navigating constant tensions between costs, performance, and strategic alignment. When applied with rigor and vision, this model acts as a true compass guiding organizations to compound capabilities and savings over time.
[1] Geoffrey Moore’s Innovation Adoption Curve categorizes the process of new product or technology adoption into five segments: Innovators (2.5%), Early Adopters (13.5%), Early Majority(34%), Late Majority (34%), and Laggards (16%). This model assists businesses in understanding the market dynamics and adapting strategies for each segment, emphasizing the challenge of crossing the “chasm” between early adopters and the early majority. Learn more here: https://a.co/d/1GcipFh
[2] Imagine a map of innovation where capabilities evolve like landscapes. Wardley Mapping charts their progress, from basic needs (consumables) to groundbreaking concepts (genesys), helping leaders navigate complex environments, prioritize investments, and fuel future growth. Learn more here: https://medium.com/wardleymaps/on-being-lost-2ef5f05eb1ec
[3] A disruption risk matrix maps potential threats based on their impact and likelihood. High-impact, high-probability disruptors demand immediate attention, driving proactive strategies and shaping future-proof business plans. This dynamic tool helps navigate volatility and stay ahead of the curve. Think of it like a two-axis chart:
- Axis 1: Disruption Impact: This measures the potential severity of the disruption. High impact disruptions could completely upend your business model, while low impact ones might only cause temporary hiccups.
- Axis 2: Disruption Likelihood: This gauges the probability of the disruption actually happening. High-likelihood threats demand immediate attention, while low-likelihood ones might be monitored but not prioritized.